missing-data-sim

https://stefvanbuuren.name/fimd/sec-MCAR.html

Load Required Packages

library(tidyverse)
── Attaching core tidyverse packages ──────────────────────── tidyverse 2.0.0 ──
✔ dplyr     1.1.4     ✔ readr     2.1.5
✔ forcats   1.0.0     ✔ stringr   1.5.1
✔ ggplot2   3.5.1     ✔ tibble    3.2.1
✔ lubridate 1.9.4     ✔ tidyr     1.3.1
✔ purrr     1.0.4     
── Conflicts ────────────────────────────────────────── tidyverse_conflicts() ──
✖ dplyr::filter() masks stats::filter()
✖ dplyr::lag()    masks stats::lag()
ℹ Use the conflicted package (<http://conflicted.r-lib.org/>) to force all conflicts to become errors
library(mice)

Attaching package: 'mice'

The following object is masked from 'package:stats':

    filter

The following objects are masked from 'package:base':

    cbind, rbind
library(broom)
library(naniar) # For visualizing missingness

Missing Data Activity

Background
You are analyzing data from a study investigating how sleep quality and stress influence academic performance (GPA) in high school students.

Variables:

  • Sleep quality (actigraphy-based, continuous)

  • Stress level (self-report scale, continuous)

  • GPA (end-of-semester)

Three missing data scenarios were created:

  1. MCAR: Some sleep trackers were lost at random.

  2. MAR: Students with higher stress levels are less likely to wear the sleep tracker.

  3. MNAR: Students with low GPA are more likely to skip GPA reporting.

Part 1: Explore the Missingness

  • Use naniar::gg_miss_var() to visualize which variables have missingness and how much.

  • Which variables are most affected in each scenario?

  • How would this affect your analysis if you used listwise deletion?

Part 2: Analyze Using Different Methods

For each dataset (MCAR, MAR, MNAR):

  • Fit a linear model (y ~ x1 + x2) using listwise deletion. Save the coefficients.

  • Use mean imputation to replace missing values in x1 and x2, then refit the model. Save results.

  • Use multiple imputation via mice, then pool and extract estimates. Save results.

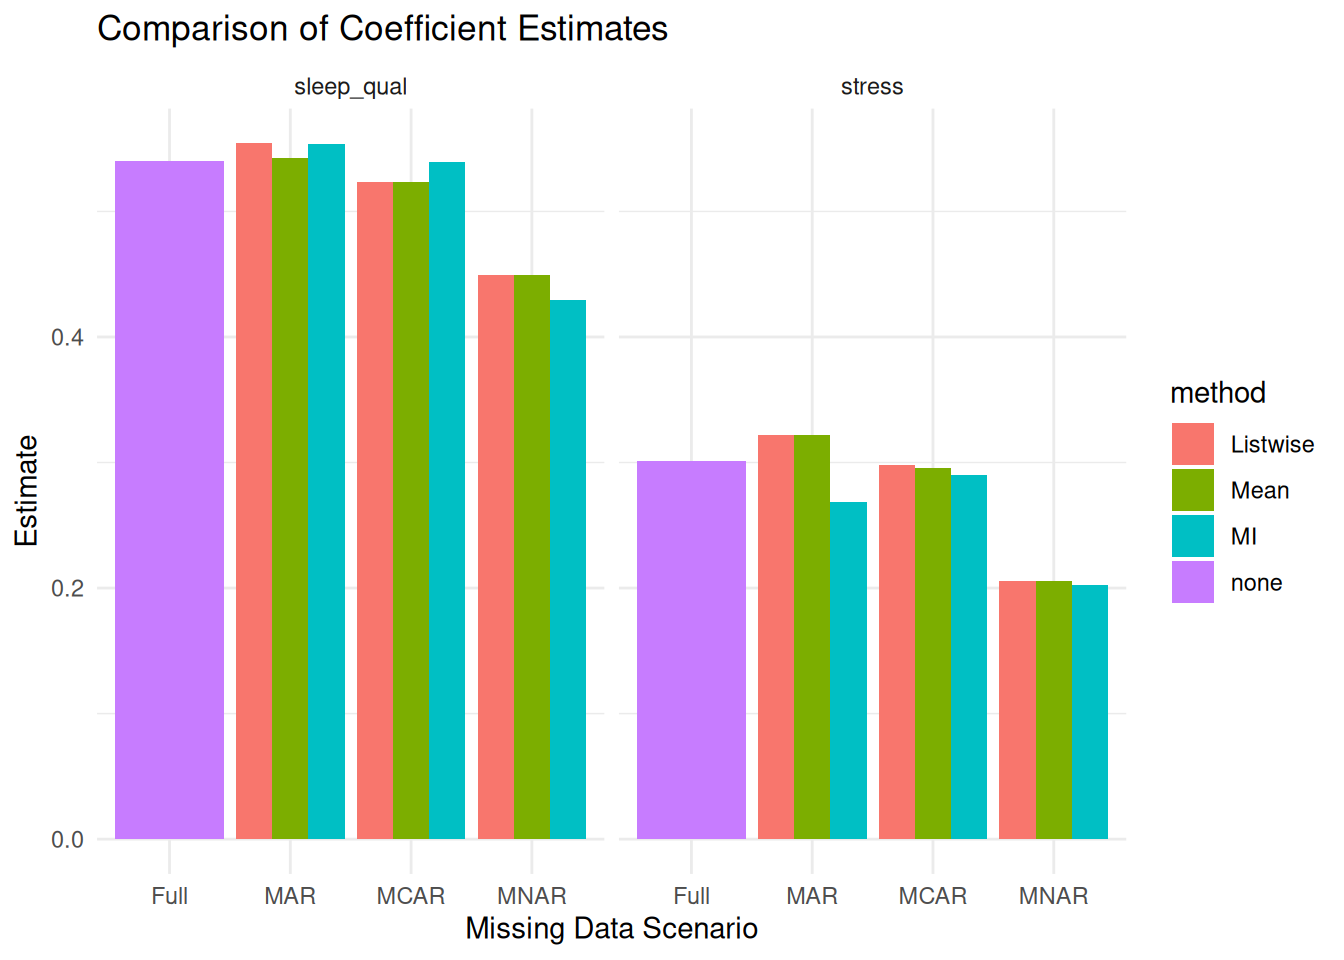
  • Compare your coefficients to the full (complete data) model. Which method is closest to the true values?

Part 3: Reflect and Discuss

Which method performed best for each scenario? Why?

Which scenario would you feel most confident analyzing and reporting? Least confident? Explain.

Ethical question:

MNAR Case: GPA missing due to low performance

Is it ethical to impute GPA?

  • Could it misrepresent actual student needs?

  • How would decisions based on imputed data affect interventions?

Simulate Dataset

You are conducting a study examining how sleep quality and stress levels predict academic performance in a sample of high school students.

set.seed(42)

#sample Size
n <- 500

sim_data <- tibble(
  sleep_qual = rnorm(n),
  stress = rnorm(n),
  acad_perf  = 0.5 * sleep_qual + 0.3 * stress + rnorm(n)
)

Missing Data Scenarios

# MCAR: Sleep Quality missing at random
data_mcar <- sim_data %>%
  mutate(sleep_qual = if_else(row_number() %in% sample(1:n, 100), NA_real_, sleep_qual))

# MAR: Stress missing based on Sleep Quality
data_mar <- sim_data %>%
  mutate(prob_miss = plogis(sleep_qual),
         stress = if_else(runif(n) < prob_miss, NA_real_, stress)) %>%
  select(-prob_miss)

# MNAR: Academic Performance missing based on Academic Performance itself
data_mnar <- sim_data %>%
  mutate(prob_miss = plogis(acad_perf),
         acad_perf = if_else(runif(n) < prob_miss, NA_real_, acad_perf)) %>%
  select(-prob_miss)

Fit Models

# Function to fit a model and extract coefficients
fit_model <- function(data, formula = acad_perf ~ sleep_qual + stress) {
  lm(formula, data = data) %>%
    tidy()
}

Full Data

full_data <- sim_data %>% 
  fit_model()

Listwise Deletion

listwise_mcar <- data_mcar %>% 
  drop_na() %>% 
  fit_model()

listwise_mar  <- data_mar  %>% 
  drop_na() %>% 
  fit_model()

listwise_mnar <- data_mnar %>% 
  drop_na() %>% 
  fit_model()

Remove rows with missing values.

Simple and easy
Reduces sample size and can introduce bias

Mean Imputation

Only doing this for Sleep Quality and Stress variables

# Function for mean imputation
mean_impute <- function(data) {
  data %>%
    mutate(sleep_qual = if_else(is.na(sleep_qual), 
                        mean(sleep_qual, na.rm = TRUE), 
                        sleep_qual),
           stress = if_else(is.na(stress), 
                            mean(stress, na.rm = TRUE), 
                            stress))
}

## Fitting the models
mean_mcar <- data_mcar %>% 
  mean_impute() %>% 
  fit_model()

mean_mar  <- data_mar  %>% 
  mean_impute() %>% 
  fit_model()

mean_mnar <- data_mnar %>% 
  mean_impute() %>% 
  fit_model()

Replace missing values with the mean.

Easy to implement
Underestimates variability, can bias estimates

Multiple Imputation (mice)

mice_fit <- function(data, m = 5) {
  imp <- mice(data, m = m, printFlag = FALSE)
  pool(with(imp, lm(acad_perf ~ sleep_qual + stress))) %>% tidy()
}

mi_mcar <- mice_fit(data_mcar)
mi_mar  <- mice_fit(data_mar)
mi_mnar <- mice_fit(data_mnar)

Use mice to create and pool multiple imputed datasets.

Preserves variability and uncertainty
More accurate with MAR data
Assumes correct imputation model

Combine Results

bind_rows(
  full_data %>% mutate(method = "none", scenario = "Full"),
  listwise_mcar %>% mutate(method = "Listwise", scenario = "MCAR"),
  listwise_mar  %>% mutate(method = "Listwise", scenario = "MAR"),
  listwise_mnar %>% mutate(method = "Listwise", scenario = "MNAR"),
  mean_mcar     %>% mutate(method = "Mean", scenario = "MCAR"),
  mean_mar      %>% mutate(method = "Mean", scenario = "MAR"),
  mean_mnar     %>% mutate(method = "Mean", scenario = "MNAR"),
  mi_mcar       %>% mutate(method = "MI", scenario = "MCAR"),
  mi_mar        %>% mutate(method = "MI", scenario = "MAR"),
  mi_mnar       %>% mutate(method = "MI", scenario = "MNAR")
) %>%
  filter(term != "(Intercept)") %>%
  ggplot(aes(x = scenario, y = estimate, fill = method)) +
  geom_col(position = "dodge") +
  facet_wrap(~term) +
  labs(title = "Comparison of Coefficient Estimates",
       y = "Estimate", x = "Missing Data Scenario") +
  theme_minimal()

Realistic Missingness Scenarios

MCAR (Missing Completely at Random)

Some students accidentally lost their actigraphy devices, and their sleep data is missing. This happened randomly across the sample.

Implication: No systematic bias, but listwise deletion reduces power.

MAR (Missing at Random)

Students with higher stress were more likely to skip the sleep tracking part of the study because they felt overwhelmed. As a result, sleep data is more likely to be missing for students with high stress.

Implication: Bias is introduced unless the stress variable is used during imputation.

MNAR (Missing Not at Random)

Students who were failing classes were more likely to avoid reporting GPA due to embarrassment or fear of consequences. Thus, missingness in GPA is directly related to GPA itself.

Implication: Hardest case—there’s no observed variable to “explain” the missingness, and imputations are highly assumption-dependent.