Lab 12: Categories & Regression
Instructions
Answer the questions below:
High correlation, good or bad? Two friends, Frances and Annika, are in disagreement about whether high correlation values are always good in the context of regression. Frances claims that it’s desirable for all variables in the dataset to be highly correlated to each other when building linear models. Annika claims that while it’s desirable for each of the predictors to be highly correlated with the outcome, it is not desirable for the predictors to be highly correlated with each other. Who is right: Frances, Annika, both, or neither? Explain your reasoning using appropriate terminology.
Meat consumption and life expectancy. In data collected for You et al. (2022), total meat intake is associated with life expectancy (at birth) in 175 countries. Meat intake is measured in kg per capita per year (averaged over 2011 to 2013). The scatterplot on the top left displays the relationship between life expectancy at birth vs. per capita meat consumption. The scatterplot on the top right displays the same relationship colored by income status of the country. The set of scatterplots across the bottom display the same relationship by income status of the country.
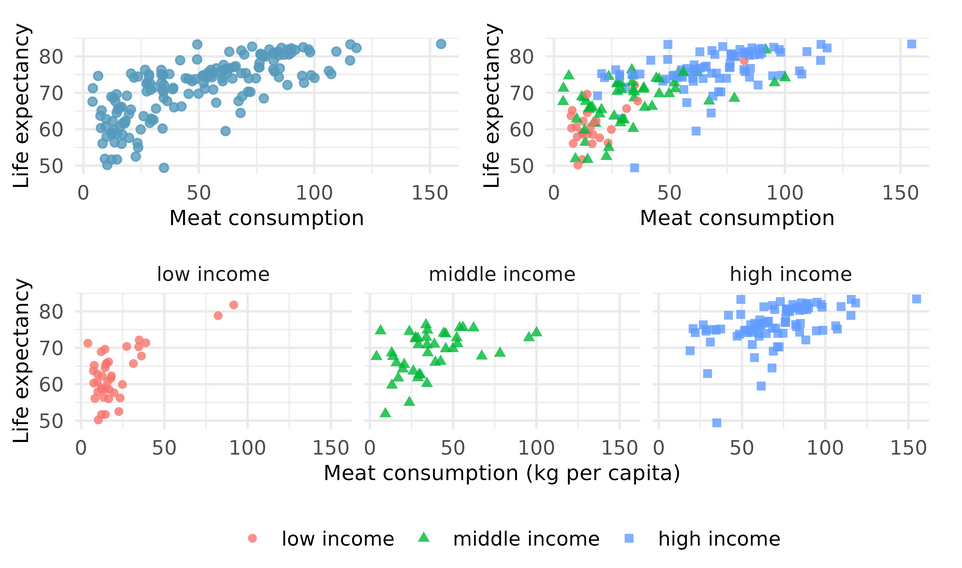
- Describe the relationship between meat consumption and life expectancy.
- Why do you think the variables are positively associated?
- Is the relationship between meat consumption and life expectancy stronger, similar, or weaker when broken down by income bracket in the separate plots along the bottom (as compared with the relationship when combined in the top left figure)?
- Baby weights and smoking. US Department of Health and Human Services, Centers for Disease Control and Prevention collect information on births recorded in the country. The data used here are a random sample of 1,000 births from 2014. Here, we study the relationship between smoking and weight of the baby. The variable smoke is coded 1 if the mother is a smoker, and 0 if not. The summary table below shows the results of a linear regression model for predicting the average birth weight of babies, measured in pounds, based on the smoking status of the mother.
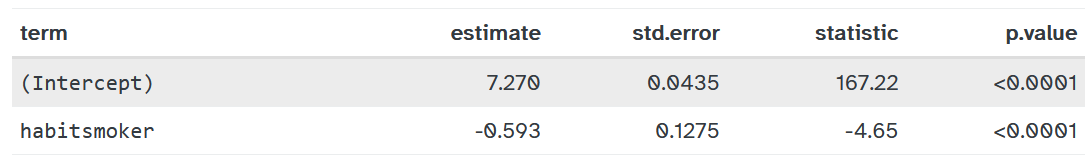
Write the equation of the regression model.
Interpret the slope in this context, and calculate the predicted birth weight of babies born to smoker and non-smoker mothers.
- Movie returns, prediction. A model was fit to predict return-on-investment (ROI) on movies based on release year and genre (Adventure, Action, Drama, Horror, and Comedy). The model output is shown below.
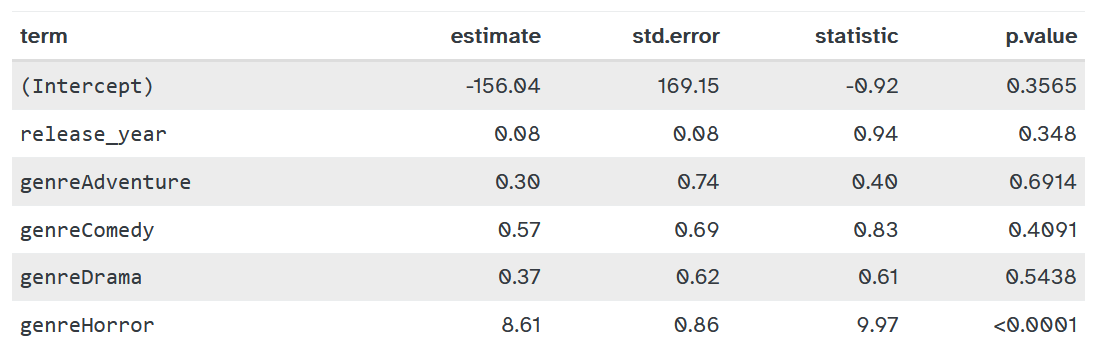
- For a given release year, which genre of movies are predicted, on average, to have the highest predicted return on investment?
- The adjusted \(R^2\) of this model is 10.71%. Adding the production budget of the movie to the model increases the adjusted \(R^2\) to 10.84%. Should production budget be added to the model? Why or Why not?